Learning Objectives
After completing this lesson, you’ll be able to:
- Know what aspects of your data to inspect when you encounter problems.
- Use feature counts to identify problems.
- Understand what rejected features are and how to use rejected feature attributes to debug a workspace.
Inspecting Output
Even if a workspace ran to completion without warnings or errors, it does not follow that the output matches what is expected or required. For whatever reason, the workspace may be producing data in the wrong manner. We can determine this by inspecting the translation output.
To inspect your output, view it in Visual Preview or the destination application.
You can inspect several aspects of data, including:
- Format: Is the data in the expected format?
- Schema: Is the data subdivided into the correct layers, categories, or classes?
- Geometry: Is the geometry in the correct spatial location? Are the geometry types suitable?
- Symbology: Is the color, size, and style of each feature correct?
- Attributes: Are all the required attributes present? Are all integrity rules being followed?
- Quantity: Does the data contain the correct number of features?
- Output: Has the translation process restructured the data as expected?
When you encounter problems, you should inspect your data to see if its components are incorrect.
Feature Counts
A workspace feature count refers to the numbers shown on each connection once a translation is complete:
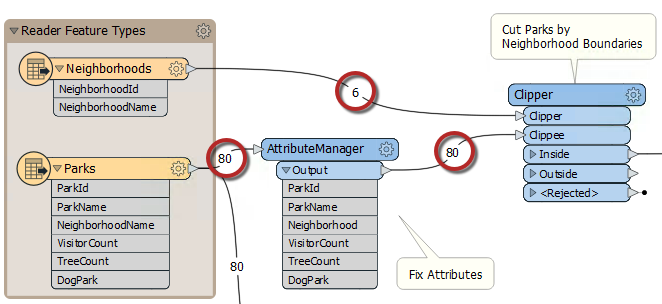
Once you find an error or problem, feature counts help us identify where that problem occurred.
In the above screenshot, if the Clipper output were incorrect, then you would inspect the prior feature counts to see if any counts looked wrong. Perhaps you know that there are seven neighborhoods, but the feature count shows only six.
Incorrect Output
When the number of output features is incorrect, then there are several things to check.
If you get zero output, and the feature counts show that all features entered a transformer, but none emerged, then you can be reasonably confident that the transformer is the cause of the problem:
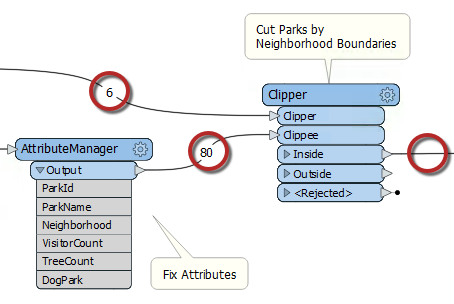
For example, 80 features enter the Clipper transformer (to be clipped against a single boundary), but none emerged. The Clipper transformer is almost certainly the cause of any incorrect output.
The transformer does not reject the data; it merely does not pass the test expected. It's possible that Clipper and Clippee don't occupy the same coordinate system; hence, one does not fall inside the other.
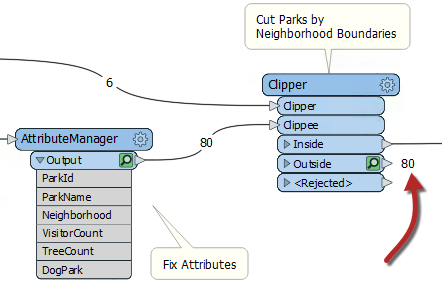
Turning on feature caching helps to confirm this to be the case:
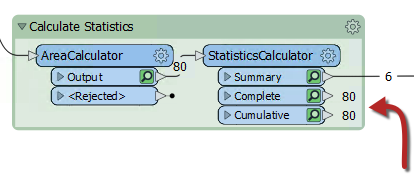
Alternatively – and this is a common cause of missing features – the author has connected the wrong output port! For example, this user connected the StatisticsCalculator Summary output port when they wanted the features from the Complete port:
You can observe feature counts and feature caches to ensure you are getting the expected number of features and they look correct.
Rejected Features
Sometimes when features go missing, they are being rejected by a transformer. Many transformers include a <Rejected> port to output these invalid features:
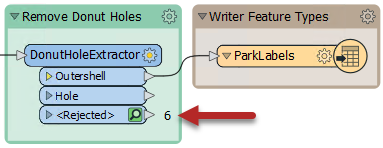
Remember, features are automatically counted and stored on a <Rejected> port, even if feature caching is off.
As an additional benefit, the rejected features will often include a rejection code attribute explaining the problem:
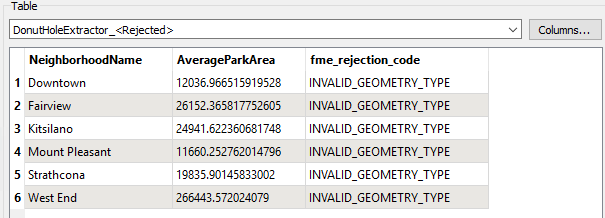
Simply reading a rejection code can often help you identify the problem. If it does not, you can refer to the transformer documentation for more information.
